Write a Python Debugger
Table of Contents
Something happened around 2009 to Python debuggers. I don't know why, but like dinosaurs, they stopped being developed1. That's how it felt when I needed a remote debugger. Each one I tried while writing application plugins had an issue. The latest supported version was Python 2.6 and I needed Python 3. The debugger used termios which isn't portable. Debugging only worked locally and not with the remote application. It was always something. I tried everything on PyPi and anything I could find on GitHub. "Fine," I said, "if I have to debug everyone's debugger anyway, I'll just write my own. It can't be that much harder." Actually, it's not. And learning how a tool works always helps debugging programs that use the tool (including debuggers themselves).
What's a stack frame?
To understand a debugger, you need to know about the "call stack".
When a function gets called, something like the following
happens2. Python creates a scope where the stuff defined in each
function is valid. Basically, different chunks of memory are used for
the execution of that block of code. This is done, for instance, so
that variables of the same name in two different functions don't
collide. Notice that both foo and bar assign an "x" variable.
The different function calls don't change the value of the "x"s used
outside the function.
 1: x = 0
 2:
 3: def bar():
 4:     x = 2
 5:     print("bar", x)
 6:
 7: def foo():
 8:     x = 1
 9:     print("foo", x)
10:     bar()
11:
12:
13: if __name__ == '__main__':
14:     print(x)
15:     foo()
16:     print(x)
0
foo 1
bar 2
0
Each portion of memory is called a "frame". A "stack" of frames is
constructed for successive calls. To belabor the point, consider the
following program. The first function calls the second, the
second calls the third, and so forth.
 1: def fourth():
 2:     print("in fourth (top/newest frame)")
 3:
 4: def third():
 5:     print("in third")
 6:     fourth()
 7:
 8: def second():
 9:     print("in second")
10:     third()
11:
12: def first():
13:     print("in first (bottom/oldest frame)")
14:     second()
15:
16:
17: if __name__ == '__main__':
18:     first()
in first (bottom/oldest frame)
in second
in third
in fourth (top/newest frame)
The memory space for each function exists until the function
returns. Since function calls can be nested, the frames "stack" up.
What the call stack looks like depends on where the program is during
execution. The frame created by the most recent call defines the top
frame, the newest frame. Similarly, the oldest frame, the first call
made, is the bottom frame. In this case, the stack is printed from
the perspective of the point in time when the program is in fourth.
Because of how the printing is being done, the stack is printed
backwards (upside down).
Frames in Python are represented by frame objects. Since a debugger needs to be able to navigate the stack, it needs to work with frame objects.
Working with stack frames
At the lowest level, the Python standard library provides the
sys.settrace function and sys._getframe() functions3 , 4 , 5.
I'll say it up front, you probably won't implement a debugger using
sys.settrace directly. Python provides several modules that
implement what you'd likely write. However, it's worth understanding
how sys.settrace works since the tooling Python provides uses it.
Using sys.settrace
The docstring for sys.settrace says,
– Function: sys.settrace (tracefunc)
Set the system's trace function, which allows you to implement a Python source code debugger in Python. …
The "system's trace function" is a function that gets called for
various events, like on a function call, execution of a new line of
code, or a return. It takes three arguments: frame, event, and
arg. These are passed in by Python during run-time. The frame is
the current stack frame, event is a string (e.g. 'call', 'line',
'exception', etc.) describing the event, and arg is something used
depending on the event type.
For example,
 1: import sys
 2:
 3:
 4: def main():
 5:     print("entering main")
 6:     print("doing some main stuff")
 7:     print("exiting main")
 8:
 9: def my_tracer(frame, event, arg):
10:     print(f"{frame=} {event=} {arg=}")
11:
12:
13: if __name__ == '__main__':
14:     sys.settrace(my_tracer)
15:     main()
frame=<frame at 0x844db0, file '<stdin>', line 4, code main> event='call' arg=None
entering main
doing some main stuff
exiting main
We set the trace function to my_tracer() before calling the main()
function. A 'call' event happens when entering the new local scope of
main(), triggering the trace function.
There are actually two levels a trace functions operates at: system
and local. The sys.settrace function sets the system trace function.
Within the system trace function, you can set a trace function to
trace the new scope it enters. There are two ways to set the local
trace function.
One way to set the local trace function is to return a trace function from within the previous (in this case system) trace function:
 1: import sys
 2:
 3:
 4: def main():
 5:     print("entering main")
 6:     print("doing some main stuff")
 7:     print("exiting main")
 8:
 9: def my_tracer(frame, event, arg):
10:     print(f"{frame=} {event=} {arg=}")
11:
12:     # recursively set my_tracer to trace each frame
13:     return my_tracer
14:
15:
16: if __name__ == '__main__':
17:     sys.settrace(my_tracer)
18:     main()
frame=<frame at 0x1ff5db0, file '<stdin>', line 4, code main> event='call' arg=None
frame=<frame at 0x1ff5db0, file '<stdin>', line 5, code main> event='line' arg=None
entering main
frame=<frame at 0x1ff5db0, file '<stdin>', line 6, code main> event='line' arg=None
doing some main stuff
frame=<frame at 0x1ff5db0, file '<stdin>', line 7, code main> event='line' arg=None
exiting main
frame=<frame at 0x1ff5db0, file '<stdin>', line 7, code main> event='return' arg=None
Another way is to set the frame object's trace function explicitly:
 1: import sys
 2:
 3:
 4: def main():
 5:     print("entering main")
 6:     print("doing some main stuff")
 7:     print("exiting main")
 8:
 9: def my_tracer(frame, event, arg):
10:     print(f"{frame=} {event=} {arg=}")
11:
12:     # recursively set my_tracer on each local frame
13:     frame.f_trace = my_tracer
14:
15:
16: if __name__ == '__main__':
17:     sys.settrace(my_tracer)
18:     main()
frame=<frame at 0x58edb0, file '<stdin>', line 4, code main> event='call' arg=None
frame=<frame at 0x58edb0, file '<stdin>', line 5, code main> event='line' arg=None
entering main
frame=<frame at 0x58edb0, file '<stdin>', line 6, code main> event='line' arg=None
doing some main stuff
frame=<frame at 0x58edb0, file '<stdin>', line 7, code main> event='line' arg=None
exiting main
frame=<frame at 0x58edb0, file '<stdin>', line 7, code main> event='return' arg=None
Most of the interesting things that happen with a debugger use the
frame object. The event is used mainly for control: if the event
type is something you want handle, then check for it and do whatever
accordingly.
The frame object documentation is a little spread out6. Frame
objects have one method, Frame.clear(). Attributes are either
read-only or writable. Here are my notes on frame objects:
Frame Object
============

Attributes
----------

 | Frame.f_back
 |
 |   to previous stack frame (towards caller). None if at bottom.
 |
 | Frame.f_code
 |
 |   the code object (.pyc) being executed this frame
r|
e| Frame.f_locals
a|
d|   local variable dict
 |
o| Frame.f_globals
n|
l|   global variable dict
y|
 | Frame.f_builtins
 |
 |   "intrinsic names"
 |
 | Frame.f_lasti
 |
 |   precise instruction; index into bytecode string

 | Frame.f_trace
 |
 |   function called (if not None) for various events during
 |   execution; used by debugger. Set implicitly to the returned
 |   value, but can be set explicitly.
w|
r| Frame.f_trace_lines
i|
t|   when True, trigger an event for each new source line (f_trace
a|   is called on each event)
b|
l| Frame.f_trace_opcodes
e|
 |   some implementations may allow per-opcode events when set True
 |
 | Frame.f_lineno
 |
 |   current line number of frame.  Jump to given line when written
 |   to by the bottom-most frame

Methods
-------

Frame.clear()

  Clear all references to local variables.  Finalize generator if
  frame belongs to one.
The sys.settrace() function is the lowest you can go in debugging
using plain Python.
Using sys._getframe
You can get you a frame at any time using sys._getframe(). It takes
a depth argument which defaults to the top of the stack (i.e. the
latest entered).
 1: import sys
 2:
 3:
 4: def fourth():
 5:     print("in fourth")
 6:     print("frame 0:", sys._getframe())
 7:     print("frame 1:", sys._getframe(1))
 8:     print("frame 2:", sys._getframe(2))
 9:     print("frame 3:", sys._getframe(3))
10:     print("frame 4:", sys._getframe(4))
11:     print("frame 5:", sys._getframe(5))
12:
13: def third():
14:     print("in third")
15:     print("frame 0:", sys._getframe())
16:     print("frame 1:", sys._getframe(1))
17:     print("frame 2:", sys._getframe(2))
18:     print("frame 3:", sys._getframe(3))
19:     print("frame 4:", sys._getframe(4))
20:     fourth()
21:
22: def second():
23:     print("in second")
24:     print("frame 0:", sys._getframe())
25:     print("frame 1:", sys._getframe(1))
26:     print("frame 2:", sys._getframe(2))
27:     print("frame 3:", sys._getframe(3))
28:     third()
29:
30: def first():
31:     print("in first")
32:     print("frame 0:", sys._getframe())
33:     print("frame 1:", sys._getframe(1))
34:     print("frame 2:", sys._getframe(2))
35:     second()
36:
37: def main():
38:     print("in main")
39:     print("frame 0:", sys._getframe())
40:     print("frame 1:", sys._getframe(1))
41:     first()
42:
43:
44: if __name__ == '__main__':
45:     print("frame 0", sys._getframe())
46:     print("entering main")
47:     main()
frame 0 <frame at 0x7f5e922e55e0, file '<stdin>', line 45, code <module>>
entering main
in main
frame 0: <frame at 0x20fbdb0, file '<stdin>', line 39, code main>
frame 1: <frame at 0x7f5e922e55e0, file '<stdin>', line 47, code <module>>
in first
frame 0: <frame at 0x7f5e92312040, file '<stdin>', line 32, code first>
frame 1: <frame at 0x20fbdb0, file '<stdin>', line 41, code main>
frame 2: <frame at 0x7f5e922e55e0, file '<stdin>', line 47, code <module>>
in second
frame 0: <frame at 0x7f5e92358900, file '<stdin>', line 24, code second>
frame 1: <frame at 0x7f5e92312040, file '<stdin>', line 35, code first>
frame 2: <frame at 0x20fbdb0, file '<stdin>', line 41, code main>
frame 3: <frame at 0x7f5e922e55e0, file '<stdin>', line 47, code <module>>
in third
frame 0: <frame at 0x7f5e92311200, file '<stdin>', line 15, code third>
frame 1: <frame at 0x7f5e92358900, file '<stdin>', line 28, code second>
frame 2: <frame at 0x7f5e92312040, file '<stdin>', line 35, code first>
frame 3: <frame at 0x20fbdb0, file '<stdin>', line 41, code main>
frame 4: <frame at 0x7f5e922e55e0, file '<stdin>', line 47, code <module>>
in fourth
frame 0: <frame at 0x7f5e922d4dc0, file '<stdin>', line 6, code fourth>
frame 1: <frame at 0x7f5e92311200, file '<stdin>', line 20, code third>
frame 2: <frame at 0x7f5e92358900, file '<stdin>', line 28, code second>
frame 3: <frame at 0x7f5e92312040, file '<stdin>', line 35, code first>
frame 4: <frame at 0x20fbdb0, file '<stdin>', line 41, code main>
frame 5: <frame at 0x7f5e922e55e0, file '<stdin>', line 47, code <module>>
You can see how the stack grows. The top is always changing and is
accessible using sys._getframe. The bottom stays the same.
User Interaction
The sys.settrace() function let's you see where you are in execution
and to navigate the stack. To have a debugger, though, you probably
want interaction. Interaction means a REPL
(i.e. read-evaluate-print-loop).
It's not too hard to write a simple REPL:
import sys


if __name__ == '__main__':
    user_input = None
    while not user_input == "exit":
        sys.stdout.write("Enter something: ")
        sys.stdout.flush()
        user_input = sys.stdin.readline().strip('\n')
        sys.stdout.write("You entered \'%s\'.\n" % user_input)
        sys.stdout.flush()
Of course, writing a good one takes effort.
Making a debugger
A debugger requires three things: a way to navigate the stack, interactivity, and a way to start the process. Since the debugger is probably separate from the program you're trying to debug, it should live in its own module. Because Python is amenable to everything being an object, there should probably be a debugger object to manage interaction. It would be a nice feature to evaluate Python code from within the debugger. It would be nice to do a lot of things…
Without further ado, I present the world's worst debugger:
# worlds_worst_debugger.py

import sys


class WorldsWorstDebugger:
    """Minimalist, tedious debugger.

    Start debugging by calling

        worlds_worst_debugger.start_debugging()

    in the file you wish to debug.  The debugger will stop on the line
    after the call to 'start_debugging' and display a prompt.  At each
    step, the prompt displays the current filename and line number.
    There is a single interactive command, 'step' which steps into the
    next line, call, return, or exception.  The user may also call
    Python code in the prompt. There is no command to continue
    execution; you must thoroughly inspect everything. Use an
    interrupt signal to stop debugging.

    """

    def start_a_repl(self, frame):
        while True:
            sys.stdout.write((f"{frame.f_code.co_filename.split('/')[-1]}: "
                              f"line {frame.f_lineno}> "))
            sys.stdout.flush()
            user_input = sys.stdin.readline().rstrip('\r\n')
            if user_input == "step":
                break
            else:
                try:
                    code = compile(user_input, '<stdin>', 'single')
                    exec(code, frame.f_locals, frame.f_globals)
                except Exception as err:
                    print(err)

    def tracer(self, frame, event, args):
        self.start_a_repl(frame)
        return self.tracer

    def set_trace(self, frame):
        frame.f_trace = self.tracer
        sys.settrace(self.tracer)


def start_debugging():
    worlds_worst_debugger = WorldsWorstDebugger()
    worlds_worst_debugger.set_trace(sys._getframe().f_back)
Let's test this out. Here's a simple program that calls a few functions and, in the middle of one of them, starts the debugger.
 1: import worlds_worst_debugger
 2:
 3: def foo(bar):
 4:     x = 1
 5:     print(bar)
 6:
 7:
 8: def main():
 9:     print("in main")
10:     worlds_worst_debugger.start_debugging()
11:     foo('baz')
12:     print("exiting main")
13:
14:
15: if __name__ == '__main__':
16:     main()
$ python3 my_worst_debugging_experience.py
in main
my_worst_debugging_experience.py: line 11> step
my_worst_debugging_experience.py: line 3> step
my_worst_debugging_experience.py: line 4> print(x)
name 'x' is not defined
my_worst_debugging_experience.py: line 4> step
my_worst_debugging_experience.py: line 5> print(x)
1
my_worst_debugging_experience.py: line 5> step
baz
my_worst_debugging_experience.py: line 5> step
my_worst_debugging_experience.py: line 12> step
exiting main
my_worst_debugging_experience.py: line 12> step
$
Are you able to follow the program flow? All told, despite being branded as the world's worst debugger, it's actually pretty powerful. The obvious features to implement next would be printing the current line, different stack navigation commands like step over, continue, and jump. Being able to set break points would be nice, too. I'll leave those as an exercise for the reader.
Using cmd.py, bdb.py, and pdb.py
Python provides several libraries to help make a debugger, in addition
to sys. These are cmd.py, bdb.py, and pdb.py. All three are
shipped with Python and live somewhere like the site-packages or
lib directory of your Python install7.
Most people are probably familiar with pdb.py. I highly recommend
getting familiar with it if not. The pdb.py module defines the
standard library's debugger. Although, it doesn't always show enough
context, it does everything else really well. It's always there and
works on all systems. The pdb debugger is an implementation of the
REPL and stack tracing concepts I've introduced. The two components,
the REPL and stack navigation, are broken out into cmd.py and
bdb.py.
The cmd.py module stands for "command interpreter". It implements a
basic, but not bare bones, line-oriented command interpreter (i.e.
REPL). You can inherit (i.e. mixin) the Cmd class within a class of
your own. Call cmdloop to start the REPL. The Cmd class expects
various methods to be over-written (e.g. precommand or postloop)
and for custom commands to be handled by methods named
"do_<your-custom-command>". Any commands without a handler go
through the default method. The cmd.py module also does
completion and some other things people might care about. Check the
top of the module for a more detailed description.
The bdb.py module probably stands for "basic debugger". It provides
the Bdb class which implements the tedious and obvious (from a
user-perspective, but not necessarily a developer perspective) trace
handling. This is where all the "step", "next", "continue", and break
point stuff in pdb comes from. The Bdb class can be inherited
just like Cmd. In fact, pdb inherits from both Bdb and
Cmd. The main take-away is that most pdb functionality we might
think of, like stepping, comes from bdb.py. The Bdb object
provides various "user_call", "user_line", etc. methods that get
called on the corresponding trace event.
Making a remote debugger "from scratch"
A remote debugger is a debugger that allows control to happen from a separate process. That process could live on a different computer, or maybe it's just a separate environment on the same machine. There are several ways a remote debugger could be implemented. A basic scheme would work exactly like a local debugger, but rather than have the REPL be controlled from the same process as the debugger, accept commands from another process.
Sockets are one way to handle interprocess communication (IPC). If
you're not familiar with them, the Python documentation has a nice
"10,000 foot overview" that should get you going (in about 6
pages)8. There are two flavors of socket calls. One flavor
treats sockets like a file, using read and write terminology. The
other views sockets as handling a stream of data which you send and
recv. Many of the functions involved with sockets correspond to low
level system calls (in spirit if not literally). IPC can get deep and
messy. Since this is not a socket tutorial, those details are glossed
over9. Fortunately, the debugger sits idle for long periods and
can work on a line-by-line basis. This allows us to pretend some
issues don't exist (and hopefully sidestep my ignorance).
Since remote debugging is about controlling the debug process, it's the REPL portion of the debugger which must work through sockets.
Annoying interlude
To give an example of how sockets can be used for a user interface, here's what I call the "Annoying Sibling Server." It's a twist on the classic echo server that all socket tutorials seem to give. Not only does it repeat everything you say to it, it says it back using an obnoxious tone.
# annoying_sibling_server.py

import sys
import socket


class AnnoyingSibling:
    """Makes a file stream annoying.

    Wraps a file-like object so that its write method outputs text
    with alternating caps.

    Parameters
    ----------

    file_stream : file object associated with a socket

      This should be the result of socket.makefile, the client
      connection socket.

    """

    def __init__(self, file_stream):
        self.file_stream = file_stream

    def write(self, s):
        annoying_s = ''

        for i, c in enumerate(s):
            annoying_s += c.upper() if i % 2 else c

        self.file_stream.write(annoying_s)

    def __getattr__(self, attr):
        # check all attribute lookups for a write call and dispatch
        # accordingly
        if attr == 'write':
            return self.write
        elif hasattr(self.file_stream, attr):
            return getattr(self.file_stream, attr)


if __name__ == '__main__':
    # create a TCP socket (SOCK_STREAM) which communicates using ipv4 (AF_INET)
    listen_socket = socket.socket(socket.AF_INET, socket.SOCK_STREAM)
    # don't hog the port when done; allow new connections
    listen_socket.setsockopt(socket.SOL_SOCKET, socket.SO_REUSEADDR, True)
    listen_socket.bind(('127.0.0.1', 4444))
    listen_socket.listen(0)

    # create a socket to handle a client connection
    (connection_socket, address) = listen_socket.accept()
    # represent the socket using the file API
    file_stream = connection_socket.makefile('rw', errors='ignore')
    # wrap the steam's 'write' method to make it annoying
    annoying_sibling_stream = AnnoyingSibling(file_stream)

    # start the REPL
    user_input = None
    while not user_input == "exit":
        user_input = annoying_sibling_stream.readline().strip('\n')
        annoying_sibling_stream.write("%s\n" % user_input)
        annoying_sibling_stream.flush()

    # clean up on exit
    file_stream.close()
    listen_socket.shutdown(socket.SHUT_RDWR)
    listen_socket.close()
Run the annoying_sibling_server.py in one shell and run a client,
like netcat (nc), in another10. The server creates a socket
that's used to accept connections. It uses TCP so that data arrives
in the order it was sent and error free. Options are set on the
socket which allow a new client to connect after another has finished
(only one client will be allowed to connect at a time). The socket is
then bound to the localhost at port 4444 and starts listening. When a
client connects, a new socket is created to manage that communication.
The client connection manager socket is then told to use a file-like
API (i.e. use read and write). The write method of the file API
is wrapped to make things annoying. Then, the REPL is started and
behaves just like the minimal example we saw before.
Once the server is running, we connect a client and try talking:
$ nc 127.0.0.1 4444
hello, world!
hElLo, WoRlD!
That's what I said...
THaT'S WhAt I sAiD...
Stop repeating me!
SToP RePeAtInG Me!
Mooooom!
MOoOoOm!
exit
eXiT
$
The remote debugger
The pdb debugger is built using bdb for trace handling and cmd
for interaction. A stripped down version of the Cmd.cmdloop REPL
looks like,
def cmdloop(self, intro):
    stop = None
    while not stop:
        if self.cmdqueue:
            line = self.cmdqueue.pop(0)
        else:
            if self.use_rawinput:
                try:
                    line = input(self.prompt)
                except EOFError:
                    line = 'EOF'
            else:
                self.stdout.write(self.prompt)
                self.stdout.flush()
                line = self.stdin.readline()
                if not len(line):
                    line = 'EOF'
                else:
                    line = line.rstrip('\r\n')
        line = self.precmd(line)
        stop = self.onecmd(line)
        stop = self.postcmd(stop, line)
We can see that the main loop of the cmd module is basically the
same as the simple REPL from earlier. It reads in data using either
input or stdin. If we set use_rawinput to False, we can ensure
that stdin is used. This would be good because stdin uses a
file-like API, just like sockets can11. We ought to be able to
replace stdin and stdout with a socket and then BAM!, we should
have a remote debugger!
Let's try it:
# my_simple_remote_debugger.py

import sys
import socket
from pdb import Pdb


class MySimpleRemoteDebugger(Pdb):

    def __init__(self):

        self.listen_socket = socket.socket(socket.AF_INET, socket.SOCK_STREAM)
        self.listen_socket.setsockopt(socket.SOL_SOCKET, socket.SO_REUSEADDR, True)
        self.listen_socket.bind(('127.0.0.1', 4444))
        self.listen_socket.listen(1)

        connection, address = self.listen_socket.accept()
        self.stream = connection.makefile('rw', errors='ignore')

        self._old_stdin_fd_or_file  = sys.stdin
        self._old_stdout_fd_or_file = sys.stdout
        self._old_stderr_fd_or_file = sys.stderr

        sys.stdin  = self.stream
        sys.stdout = self.stream
        sys.stderr = self.stream

        Pdb.__init__(self)

        # use stdin
        self.use_rawinput = False

        self.prompt = f'(MySimpleRemoteDebugger) '

    def __del__(self):
        sys.stdin = self._old_stdin_fd_or_file
        sys.stdout = self._old_stdout_fd_or_file
        sys.stderr = self._old_stderr_fd_or_file

        self.stream.close()
        self.listen_socket.shutdown(socket.SHUT_RDWR)
        self.listen_socket.close()


def breakpoint():
    DEBUGGER = MySimpleRemoteDebugger()
    DEBUGGER.frame = sys._getframe().f_back
    DEBUGGER.set_trace(DEBUGGER.frame)
It looks almost the same as the Annoying Sibling Server. There is a
MySimpleRemoteDebugger object. This gets created when the user
calls the module-level my_simple_remote_debugger.breakpoint. The
breakpoint creates a debugger, gives it the previous frame (the code
being debugged, not the my_simple_remote_debugger module). It sets
the trace and off we go. This is basically what pdb.set_trace does,
but with a way better name. Otherwise, the clean up code now lives in
the __del__ method which gets called when the debugger is killed
(e.g. on quit or continue).
Everything seems too simple. Let's try it on our previous "worst debugging experience" and see if the situation improves:
 1: # my_first_remote_debugging_experience.py
 2:
 3: import my_simple_remote_debugger
 4:
 5: def foo(bar):
 6:     x = 1
 7:     print(bar)
 8:
 9:
10: def main():
11:     print("in main")
12:     my_simple_remote_debugger.breakpoint()
13:     foo('baz')
14:     print("exiting main")
15:
16:
17: if __name__ == '__main__':
18:     main()
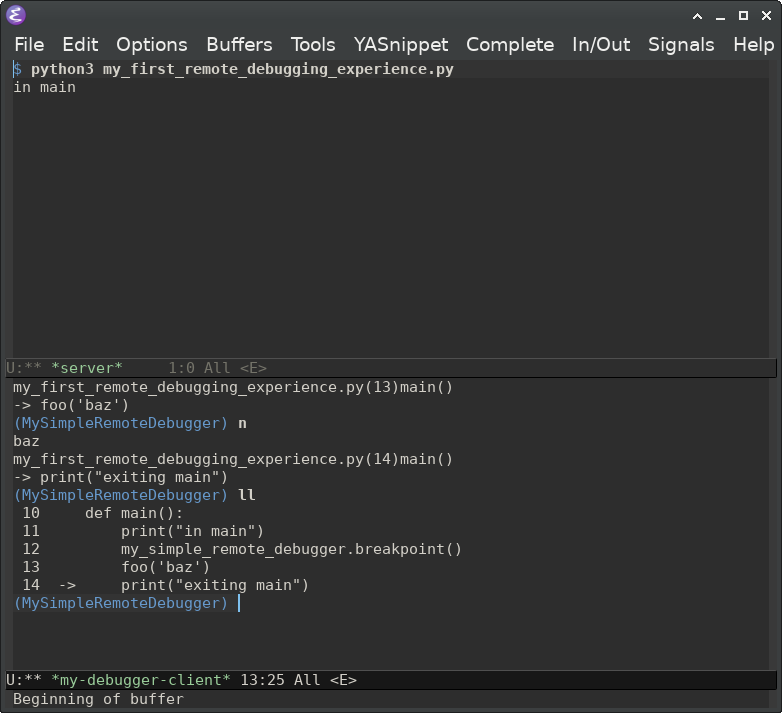
Server
$ python3 my_first_remote_debugging_experience.py
in main
Client
$ nc 127.0.0.1 4444
> my_first_remote_debugging_experience.py(13)main()
-> foo('baz')
(MySimpleRemoteDebugger) ll
 10     def main():
 11         print("in main")
 12         my_simple_remote_debugger.breakpoint()
 13  ->	    foo('baz')
 14         print("exiting main")
(MySimpleRemoteDebugger) s
--Call--
> my_first_remote_debugging_experience.py(5)foo()
-> def foo(bar):
(MySimpleRemoteDebugger) ll
  5  ->	def foo(bar):
  6         x = 1
  7         print(bar)
(MySimpleRemoteDebugger) n
> my_first_remote_debugging_experience.py(6)foo()
-> x = 1
(MySimpleRemoteDebugger) n
> my_first_remote_debugging_experience.py(7)foo()
-> print(bar)
(MySimpleRemoteDebugger) n
baz
--Return--
> my_first_remote_debugging_experience.py(7)foo()->None
-> print(bar)
(MySimpleRemoteDebugger) c
exiting main
Sweet! It's simple and effective!
Conclusion
I find it surprising how little code is needed to create a useful
debugger. While some Python debuggers aren't much more than
MySimpleRemoteDebugger, many are vastly more complex. It makes me
wonder why. What's been done here is likely the so-called 80%. The
remaining 20% is often said to take the majority of the effort. So,
how hard is it to make a debugger? The answer really seems to be, "As
hard as you want to make it." That makes for a great "Keep It Simple
Solution" in my book.
Final thoughts (and better debugger)
One of the things I find most difficult to use with pdb is its lack
of context. It shows only one line at a time. I'm always having to
type "ll" to get a long listing. This is fixed by creating some
aliases:
# If a file .pdbrc exists in the user\342\200\231s home directory or in the
# current directory, it is read with 'utf-8' encoding and executed as
# if it had been typed at the debugger prompt.

# Show context on startup
l

# Use capital letter to do the action and then print the listing
alias N 'Stepping over...'      ;; next     ;; l
alias S 'Stepping into...'      ;; step     ;; l
alias R 'Returning...'          ;; return   ;; l
alias C 'Continuing...'         ;; continue ;; l
alias U 'Going up a frame...'   ;; up       ;; l
alias D 'Going down a frame...' ;; down     ;; l
I also sometimes use ipdb for debugging. Although IPython is huge,
complicated, and I try to minimize my dependencies, sometimes it's
there (because it's someone else's project and they needed to include
matplotlib for the hex color codes). Since ipdb is built off of
pdb, it's easy to drop into our simple debugger.
import sys
import socket

try:
    from IPython.core.debugger import Pdb
    USING_IPYTHON = True
except ImportError:
    from pdb import Pdb
    USING_IPYTHON = False


class MyRemoteDebugger(Pdb):

    def __init__(self):

        ...

        if USING_IPYTHON:
            Pdb.__init__(self, context=10)
        else:
            Pdb.__init__(self)

        ...
There's also a slightly cleaner way to handle stdin and stdout in
MySimpleRemoteDebugger. Pdb overrides these and takes them as
inputs. If we only want one connection, we can use the context
feature of sockets (the with keyword) to automatically close the
socket after a connection is made.
# my_simple_remote_debugger.py

import sys
import socket
from pdb import Pdb


class MySimpleRemoteDebugger(Pdb):

    def __init__(self):

        # forces one connection per port by closing socket
        with socket.socket(socket.AF_INET, socket.SOCK_STREAM) as sock:
            # make freed port immediately available
            sock.setsockopt(socket.SOL_SOCKET, socket.SO_REUSEADDR, True)
            sock.bind(('127.0.0.1', 4444))
            sock.listen(0)

            connection, address = sock.accept()
            stream = connection.makefile('rw', errors='ignore')

            Pdb.__init__(self, stdin=stream, stdout=stream)

        # don't use readline for input (makes friendly for clients)
        self.use_rawinput = False
        self.prompt       = f'(MySimpleRemoteDebugger) '


def breakpoint():
    my_debugger = MySimpleRemoteDebugger()
    my_debugger.frame = sys._getframe().f_back
    my_debugger.set_trace(my_debugger.frame)
Overall, he's a more fleshed out debugger.
"""The Remote Python Debugger Rdb
==============================

Platform-independent remote Python debugger based on Pdb.  See
https://docs.python.org/3.12/library/pdb.html and
https://github.com/python/cpython/blob/3.12/Lib/pdb.py

Place 'rdb.py' in the local site-packages directory to make it
available to projects.

    $ python -m site --user-site
    /home/ahab/.local/lib/python3.12/site-packages/rdb.py

See https://peps.python.org/pep-0370/https://peps.python.org/pep-0370/

Set a breakpoint using

    >>> import rdb; rdb.set_trace()

or

    >>> import rdb; rdb.breakpoint()

The default host and port is 127.0.0.1:4444.

Post-mortem debugging is also available:

    def my_exception_hook(type, value, tb, thread=None):
        import rdb; rdb.pm(tb)

    import sys
    sys.excepthook = my_exception_hook

    import threading
    threading.excepthook = my_exception_hook

Rdb uses the builtin 'pdb' unless IPython 'ipdb' is installed.

Suggested ".pdbrc" aliases (home or current directory):

    # Show context on startup
    l

    alias N 'Stepping over...'      ;; next     ;; l
    alias S 'Stepping into...'      ;; step     ;; l
    alias R 'Returning...'          ;; return   ;; l
    alias C 'Continuing...'         ;; continue ;; l
    alias U 'Going up a frame...'   ;; up       ;; l
    alias D 'Going down a frame...' ;; down     ;; l

The following defines an Emacs-based client debugger for an Rdb
breakpoint.  Call M-x my-start-debugger-client.

    (defun my-start-debugger-client (&optional arg host port)
      "Connect to Rdb debugger at HOST on PORT.

    Prompt for HOST when called with universal prefix C-u.
    Otherwise, use \"127.0.0.1\"."
      (interactive "p")
      (let* ((host
              (cond ((= arg 4)
                     (read-string "host (default 127.0.0.1): " "127.0.0.1" nil "127.0.0.1"))
                    (t
                     "127.0.0.1")))
             (port (or port (read-number "port: " 4444)))
             (proc-name (format "my-debugger-client-%s-%s" host port))
             (proc-buffer (format "*%s*" proc-name)))

        (make-network-process
         :name proc-name
         :buffer proc-buffer
         :family 'ipv4
         :host host
         :service port
         :sentinel 'my--debugger-client-sentinel
         :filter 'my--debugger-client-filter)

        (switch-to-buffer proc-buffer)

        (with-current-buffer proc-buffer
          (comint-mode)
          (setq-local comint-prompt-regexp "\\((Rdb) \\|>>> \\|In \\[[[:digit:]]\\]: \\)")
          (setq-local comint-use-prompt-regexp t))))

    (defun my-stop-debugger-client nil
      (interactive)
      (delete-process "my-debugger-client"))

    (defun my--debugger-client-filter (proc string)
      (comint-output-filter proc string))

    (defun my--debugger-client-sentinel (proc msg)
      (let ((proc-buffer (format "*%s*" proc)))
        (when (string= msg "connection broken by remote peer\n")
          (with-current-buffer proc-buffer
            (insert (format "client %s has quit" proc))
            (bury-buffer)  ; keep output on close
            ;; (kill-buffer)  ; remove all output on close
            ))))

"""

import os
import sys
import socket

try:
    from IPython.core.debugger import Pdb
except ImportError:
    from pdb import Pdb


DEFAULT_HOST = "127.0.0.1"
DEFAULT_PORT = 4444


class Rdb(Pdb):

    def __init__(self, name=None, host=DEFAULT_HOST, port=DEFAULT_PORT, *args, **kwargs):

        if not name:
            name = f"pid:{os.getpid()}"

        # forces one connection per port by closing socket
        with socket.socket(socket.AF_INET, socket.SOCK_STREAM) as sock:
            # make freed port immediately available
            sock.setsockopt(socket.SOL_SOCKET, socket.SO_REUSEADDR, True)

            try:
                sock.bind((host, port))  # default or user provided port
            except OSError:
                sock.bind((host, 0))     # OS decides port

            sock.listen(0)               # number of unaccepted connections system allows before refusing new connections

            bound_host, bound_port = sock.getsockname()
            sys.stdout.write(f"[{name}] Starting remote debugger {bound_host}:{bound_port}...\n")

            connection, address = sock.accept()
            stream = connection.makefile('rw', errors='ignore')

            super().__init__(stdin=stream, stdout=stream, *args, **kwargs)

        # make client friendly, don't use readline (e.g. telnet, PuTTY)
        # See: https://docs.python.org/3.12/library/cmd.html#cmd.Cmd.use_rawinput
        self.use_rawinput = False
        self.prompt       = f"({self.__class__.__name__}) "


def breakpoint(host=DEFAULT_HOST, port=DEFAULT_PORT, name=None):
    remote_debugger = Rdb(name=name, host=host, port=port)
    remote_debugger.set_trace(sys._getframe().f_back)

set_trace = breakpoint


def post_mortem(t=None):
    """Enter post-mortem debugging of the given *traceback* object.

    If no traceback is given, it uses the one of the exception that is
    currently being handled (an exception must be being handled if the
    default is to be used).

    Modified from Python3.12 pdb.post_mortem
    """
    # handling the default
    if t is None:
        exc = sys.exception()
        if exc is not None:
            t = exc.__traceback__

    if t is None:
        raise ValueError("A valid traceback must be passed if no "
                         "exception is being handled")

    r = Rdb(name=f"pid:{os.getpid()}:post_mortem")
    r.reset()
    r.interaction(None, t)


def pm(tb=None):
    """Enter post-mortem debugging of the traceback found in sys.last_traceback.

    Modified from Python3.12 pdb.pm
    """
    if not tb:
        if hasattr(sys, 'last_exc'):
            tb = sys.last_exc.__traceback__
        else:
            tb = sys.last_traceback
    post_mortem(tb)
In my experience, this is is sufficient. I haven't come across an
instance where Rdb doesn't meet my need. There are things like
detaching and reconnecting which are possible yet not implemented.
However, I don't know why that would be helpful (if you wanted to
detach, you could create a do_detach function, as an extension to
the Cmd parent, which handles the socket appropriately). If you
find a situation that isn't handled by Rdb, hopefully you find it
simple enough to hack on.
Simple Emacs client
I'd be remiss if I didn't include this gem. While it's possible to connect to the debug server using something like netcat or PuTTY, they don't always handle text input the way we might want. For example, it's easy to get control characters to show up:
$ nc 127.0.0.1 4444
> my_first_remote_debugging_experience.py(13)main()
-> foo('baz')
(MySimpleRemoteDebugger) print()^[[D
I'm a big Emacs fan and this is a great example of why. A debug
client is a text editing task and Emacs has me covered for everything
text related (and more). I'm able to start a network process and have
a input/output buffer associated with it. Evaluate this code and run
M-x my-debugger-client-start to start the debug client.
(defun my-start-debugger-client (&optional arg host port)
  "Connect to Rdb debugger at HOST on PORT.

    Prompt for HOST when called with universal prefix C-u.
    Otherwise, use \"127.0.0.1\"."
  (interactive "p")
  (let* ((host
          (cond ((= arg 4)
                 (read-string "host (default 127.0.0.1): " "127.0.0.1" nil "127.0.0.1"))
                (t
                 "127.0.0.1")))
         (port (or port (read-number "port: " 4444)))
         (proc-name (format "my-debugger-client-%s-%s" host port))
         (proc-buffer (format "*%s*" proc-name)))

    (make-network-process
     :name proc-name
     :buffer proc-buffer
     :family 'ipv4
     :host host
     :service port
     :sentinel 'my--debugger-client-sentinel
     :filter 'my--debugger-client-filter)

    (switch-to-buffer proc-buffer)

    (with-current-buffer proc-buffer
      (comint-mode)
      (setq-local comint-prompt-regexp "\\((Rdb) \\|>>> \\|In \\[[[:digit:]]\\]: \\)")
      (setq-local comint-use-prompt-regexp t))))

(defun my-stop-debugger-client nil
  (interactive)
  (delete-process "my-debugger-client"))

(defun my--debugger-client-filter (proc string)
  (comint-output-filter proc string))

(defun my--debugger-client-sentinel (proc msg)
  (let ((proc-buffer (format "*%s*" proc)))
    (when (string= msg "connection broken by remote peer\n")
      (with-current-buffer proc-buffer
        (insert (format "client %s has quit" proc))
        (bury-buffer)  ; keep output on close
        ;; (kill-buffer)  ; remove all output on close
        ))))
Now I can do all my text editing in Emacs, which handles text editing really well, before sending it to the server.
Footnotes:
Maybe the release of Python 3 fouled the atmosphere? https://www.python.org/download/releases/3.0/
This is an over-simplification. Read something like https://sites.cs.ucsb.edu/~pconrad/cs8/topics.beta/theStack/ for more information.
This is the lowest that the Python standard library seems to provide. You can always go lower.
The settrace() documentation points you to the type
hierarchy's frame object. This gives all the attributes and methods
in paragraph form:
https://docs.python.org/3/reference/datamodel.html#the-standard-type-hierarchy
The inspect module gives this same information in a convenient table: https://docs.python.org/3/library/inspect.html#types-and-members
Call whereis python on GNU based systems (or where on
non-GNU systems) to find where Python is installed. Start poking
around, there's fun stuff in there.
If you're okay reading C, "Beej's Guide to Network Programming" is a deeper, yet still approachable guide (i.e. it's only about 80 pages, way less than the 1100 pages that's often recommended). https://beej.us/guide/bgnet/