Assembly code cheat sheet
Table of Contents
These are notes taken while working through Assembly Language Step-by-Step, 3rd Ed. by Jeff Duntemann. It's a great book which I recommend to anyone interested in learning x86 assembly programming.
Project structure and build script
I like the approach Casey Muratori takes to structuring projects in the early Handmade Hero videos.
ahab@pequod ~/Projects/asmwork$ ls
build/  code/
It's two directories, one for the source code and another for the built artifact (binary).
The code directory also has a build.sh script in it:
#!/usr/bin/env bash

# build.sh FILE

# (peut-gerer-create-shell "*build*")
# (peut-gerer-set-shell "*build*")
# (peut-gerer-set-command-prefix "./build.sh ")

INFILE=$(basename $1)
FILENAME=${INFILE%%.*}
OBJECTFILE="$FILENAME.o"
BUILDNAME="latest_build_of_$FILENAME"

mkdir -p ../build
pushd ../build

echo "1 $1"
echo "INFILE: $INFILE"
echo "FILENAME: $FILENAME"
echo "BUILDNAME: $BUILDNAME"

rm -f -- $BUILDNAME

if [[ ( $INFILE == *.asm ) || ( $INFILE == *.s ) ]]; then
    nasm -f elf -g -F stabs -o $OBJECTFILE $1
    ld -m elf_i386 -o $BUILDNAME $OBJECTFILE

    # nasm -f elf64 -o $OBJECTFILE $1
    # nasm -f elf -o $OBJECTFILE $1
    # ld -m elf_i386 -o $BUILDNAME $OBJECTFILE
    # gcc -m32 -o $BUILDNAME $OBJECTFILE
elif [[ $INFILE == *.c ]]; then
    gcc -g $1 -o $BUILDNAME
else
    echo "Invalid file type: \"$INFILE\""
    exit 1
fi

./$BUILDNAME
popd
The script takes a source file to build as input. It then pushes the
build directory onto the directory stack. It then kills the latest
build and rebuilds it according to the source file type. Finally, it
runs the build before returning to the code directory.
There are several different ways assembly code can be compiled, depending on whether it's 64 bit or 32 bit, whether the code includes C library calls, etc. At this point, there's no sense getting clever about it: just comment out what's not needed for the current source file.
Debugging
M-x gdb
I prefer Emacs for most things. However, the GDB interface for Emacs is simply horrible (this is unusual for Emacs). It takes control of the windows, forces their arrangement, and generally makes for a miserable experience.
After an annoying amount of fiddling, I came up with the following:
;; gdb-configure.el

(setq gdb-many-windows t)

(defun xc/gdb-setup-windows ()
  "Override the default window layout pattern for option `gdb-many-windows'."

  ;; create all possible buffers given by `gdb-buffer-rules'
  (gdb-get-buffer-create 'gdb-registers-buffer)
  (gdb-get-buffer-create 'gdb-locals-buffer)
  (gdb-get-buffer-create 'gdb-stack-buffer)
  (gdb-get-buffer-create 'gdb-disassembly-buffer)
  (gdb-get-buffer-create 'gdb-memory-buffer)
  (gdb-get-buffer-create 'gdb-threads-buffer)
  (gdb-get-buffer-create 'gdb-breakpoints-buffer)
  (gdb-get-buffer-create 'gdb-partial-output-buffer)

  ;; Define a window setup.
  ;;
  ;; +------------------+------------------+
  ;; |                  |                  |
  ;; |                  |     win1         |
  ;; |                  |                  |
  ;; |                  |                  |
  ;; |                  +------------------+
  ;; |                  |                  |
  ;; |                  |     win3         |
  ;; |     win0         |                  |
  ;; |                  |                  |
  ;; |                  +------------------+
  ;; |                  |                  |
  ;; |                  |     win2         |
  ;; |                  |                  |
  ;; |                  |                  |
  ;; +------------------+------------------+

  (delete-other-windows)
  (let* ((full-height (window-height))
         (third-height (/ full-height 3))
         win0
         win1
         win2
         win3
         )
    (setq win0 (selected-window))
    (setq win1 (split-window-right))
    (select-window win1)
    (setq win2 (split-window nil (- full-height third-height)))
    (setq win3 (split-window nil third-height))

    ;; gdb names several buffers after the program being debugged and
    ;; provides functions to get the buffer name.  How this happens
    ;; isn't the same for all buffers.  For example, the
    ;; gdb-memory-buffer created above is first called "limbo" before
    ;; the (gdb-memory-buffer-name) function returns anything.  You
    ;; would have to rename the memory buffer yourself.
    ;;
    ;; (gdb-registers-buffer-name)
    ;; (gdb-locals-buffer-name)
    ;; (gdb-stack-buffer-name)
    ;; (gdb-disassembly-buffer-name)
    ;; (gdb-threads-buffer-name)
    ;; (gdb-breakpoints-buffer-name)
    ;; (gdb-partial-output-name)
    ;; (gdb-memory-buffer-name)
    ;; gud-comint-buffer
    ;; gdb-main-file

    ;; win0
    (select-window win0)
    (switch-to-buffer
     (if gdb-main-file
         (gud-find-file gdb-main-file)
       ;; Put buffer list in window if we
       ;; can't find a source file.
       (list-buffers-noselect)))

    ;; win1
    (set-window-buffer win1 (gdb-locals-buffer-name))

    ;; win2
    (select-window win2)
    (switch-to-buffer gud-comint-buffer)

    ;; win3
    (select-window win3)
    (set-window-buffer win3 (gdb-stack-buffer-name))

    (select-window win2)
    ))

(defalias 'gdb-setup-windows #'xc/gdb-setup-windows)
Straight gdb
The best solution for debugging I've found is to use straight gdb
from the command-line. They provide an awesome text user interface
(TUI) in addition to the plain text interface. I found it best to use
a directory local init file to set the TUI up for my assembly
projects. This way, the configuration didn't get in the way of any
non-assembly debugging.
1. Configure GDB to load local init files
As of GDB 7.5, GDB will only load trusted init files. This means that
simply putting a .gdbinit in the project directory won't work. You
must tell GDB what's safe to load.
GDB reads init files based on some directory ordering. By default, I believe, it looks in the home directory first.
My installation (or first run of GDB) created a .gdbinit file:
# ~/.gdbinit

# Tell GDB where to look for separate debugging files.
set debug-file-directory ~/.guix-profile/lib/debug

# Authorize extensions found in the store, such as the
# pretty-printers of libstdc++.
set auto-load safe-path /gnu/store/*/lib

# load local .gdbinit
set auto-load safe-path .
The first two lines were there by default. The first line tells GDB where it can look for debug information. To quote the docs,
GDB allows you to put a program’s debugging information in a file separate from the executable itself, in a way that allows GDB to find and load the debugging information automatically. Since debugging information can be very large—sometimes larger than the executable code itself—some systems distribute debugging information for their executables in separate files, which users can install only when they need to debug a problem.
The second line sets a safe path for any GDB extensions the user may have installed.
The third line was added by me. It says that any path in this directory or below is safe to load.
2. Create directory local init
Create a file called .gdbinit in the project directory.
# use "starti" to start at first instruction

set disassembly-flavor intel
layout asm
layout regs
The first line sets the assembly language to Intel which is what the book uses. GDB defaults to 68000.
The next two lines set up the TUI. The layout command enables
interfaces for registers (regs) and the code (asm).
Use focus to switch between the windows.
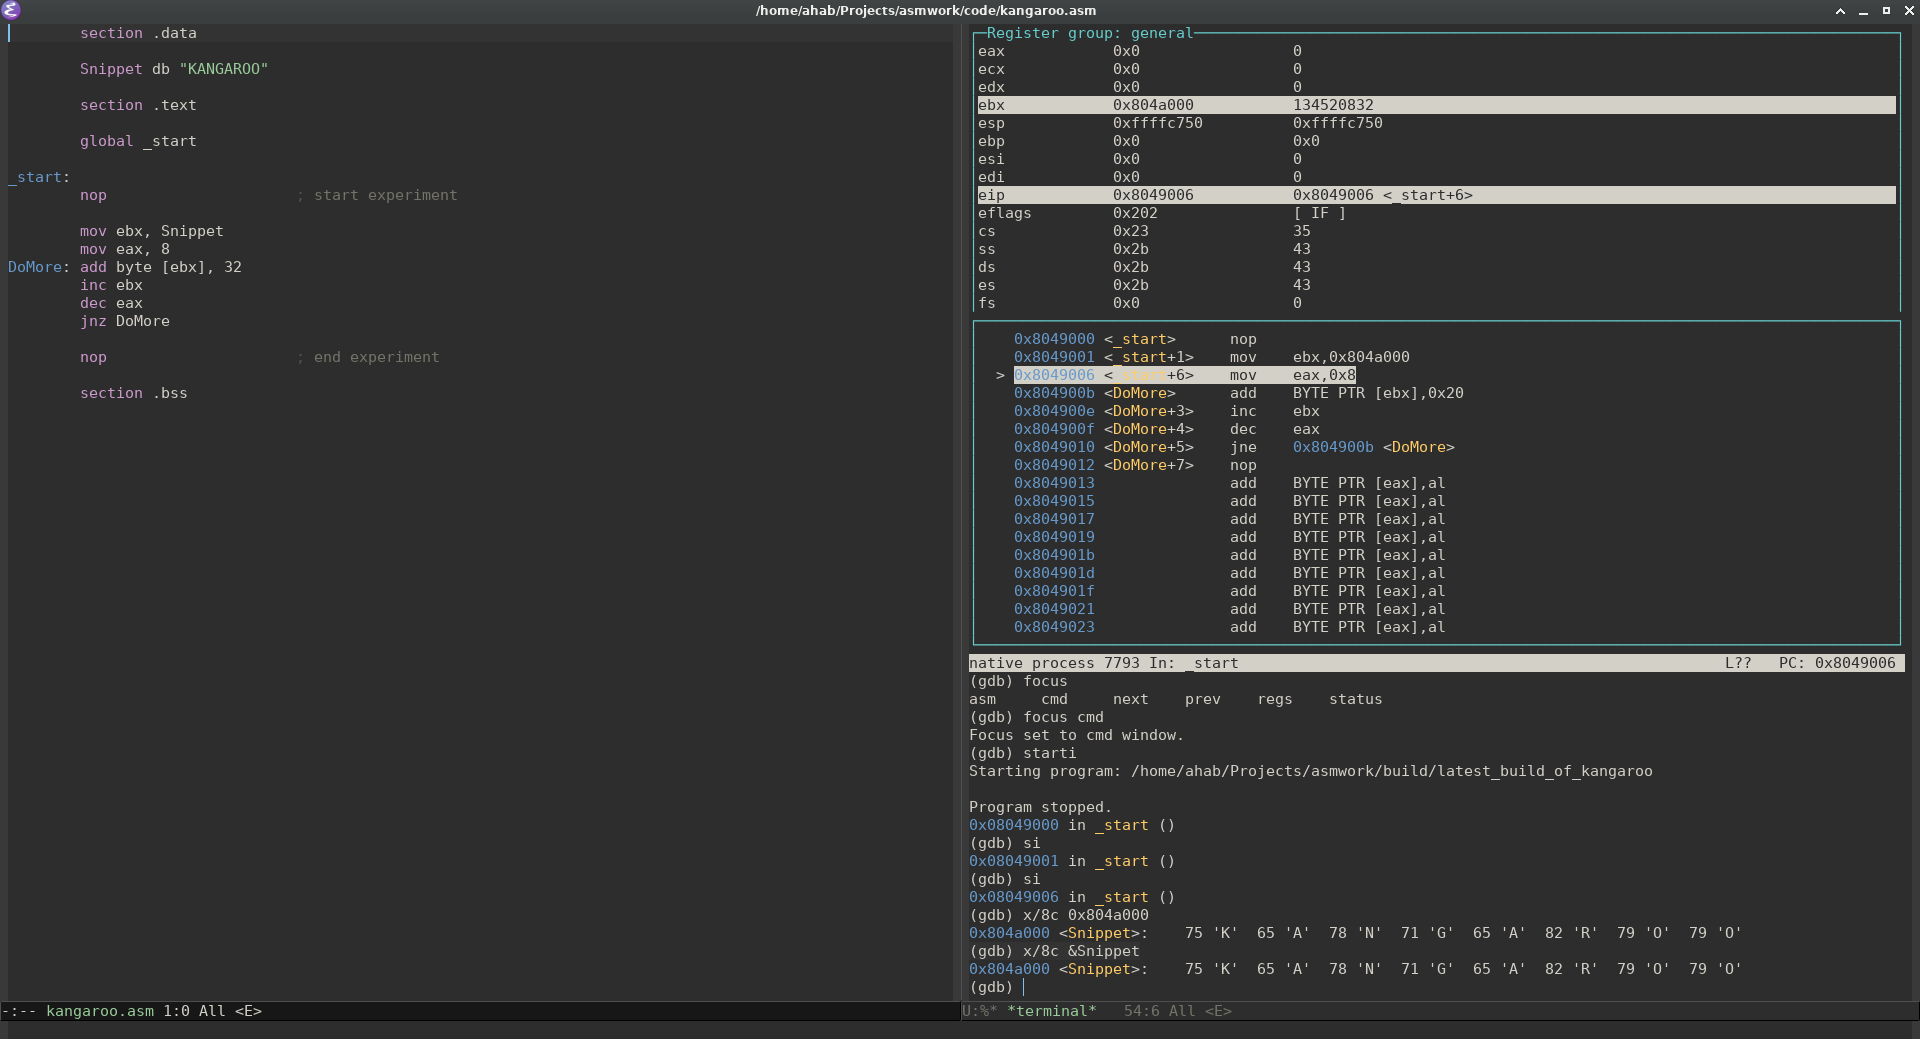
Start debugging assembly with starti (start instruction level
debugging) and use si to step through each instruction.
Examine memory with x:
(gdb) help x
Examine memory: x/FMT ADDRESS.
ADDRESS is an expression for the memory address to examine.
FMT is a repeat count followed by a format letter and a size letter.
Format letters are o(octal), x(hex), d(decimal), u(unsigned decimal),
  t(binary), f(float), a(address), i(instruction), c(char), s(string)
  and z(hex, zero padded on the left).
Size letters are b(byte), h(halfword), w(word), g(giant, 8 bytes).
The specified number of objects of the specified size are printed
according to the format.  If a negative number is specified, memory is
examined backward from the address.

Defaults for format and size letters are those previously used.
Default count is 1.  Default address is following last thing printed
with this command or "print".
Since labels are memory addresses, we can use either as the address. However, in GDB, you must use the address of the label1.
Memory watch
Working with memory addresses requires a "hardware breakpoint". This requires use of Valgrind. However, since the book has us compiling in 32 bit, Valgrind throws the error:
ahab@pequod ~/Projects/asmwork/build$ valgrind --vgdb=yes --vgdb-error=0 latest_build_of_kangaroo
valgrind: failed to start tool 'memcheck' for platform 'x86-linux': No such file or directory
The error is because Valgrind no longer supports 32-bit x86. The last release that appears to is 3.12:
Whilst 3.12.0 continues to support the 32-bit x86 instruction set, we would prefer users to migrate to 64-bit x86 (a.k.a amd64 or x8664) where possible. Valgrind's support for 32-bit x86 has stagnated in recent years and has fallen far behind that for 64-bit x86 instructions. By contrast 64-bit x86 is well supported, up to and including AVX2.
This means that I'd likely have to compile 3.12 from source. However, since I'm on Guix, I may be able to easy. The definition for Valgrind is not large.
TODO Syntax
Assembler syntax is separate from the base machine opcodes!
References
- https://sourceware.org/gdb/onlinedocs/gdb/Auto_002dloading-safe-path.html
- https://sourceware.org/gdb/onlinedocs/gdb/Separate-Debug-Files.html
- https://stackoverflow.com/questions/32195358/assembly-how-to-see-the-value-in-a-particular-variable-with-gdb
- https://guide.handmadehero.org/code/
- https://stackoverflow.com/questions/11004374/watch-a-memory-range-in-gdb
- https://valgrind.org/docs/manual/dist.news.html
- https://www.felixcloutier.com/x86/
- https://stackoverflow.com/questions/71851403/add-instruction-forms-intel-manual-doesnt-describe-operand-size-overrides-like